Hover over a chart to get the data. The top chart is solar panel array output in volts and amps, and battery bank input in volts and amps.
The bottom chart shows panel power in watts, battery power in watts, and the sun's elevation (altitude) and azimuth (compass heading) in degrees.
The times are in 24-hour format: 3PM =15:00 (3+12=15). Also note the Panel Array power and Battery power are usually equal.
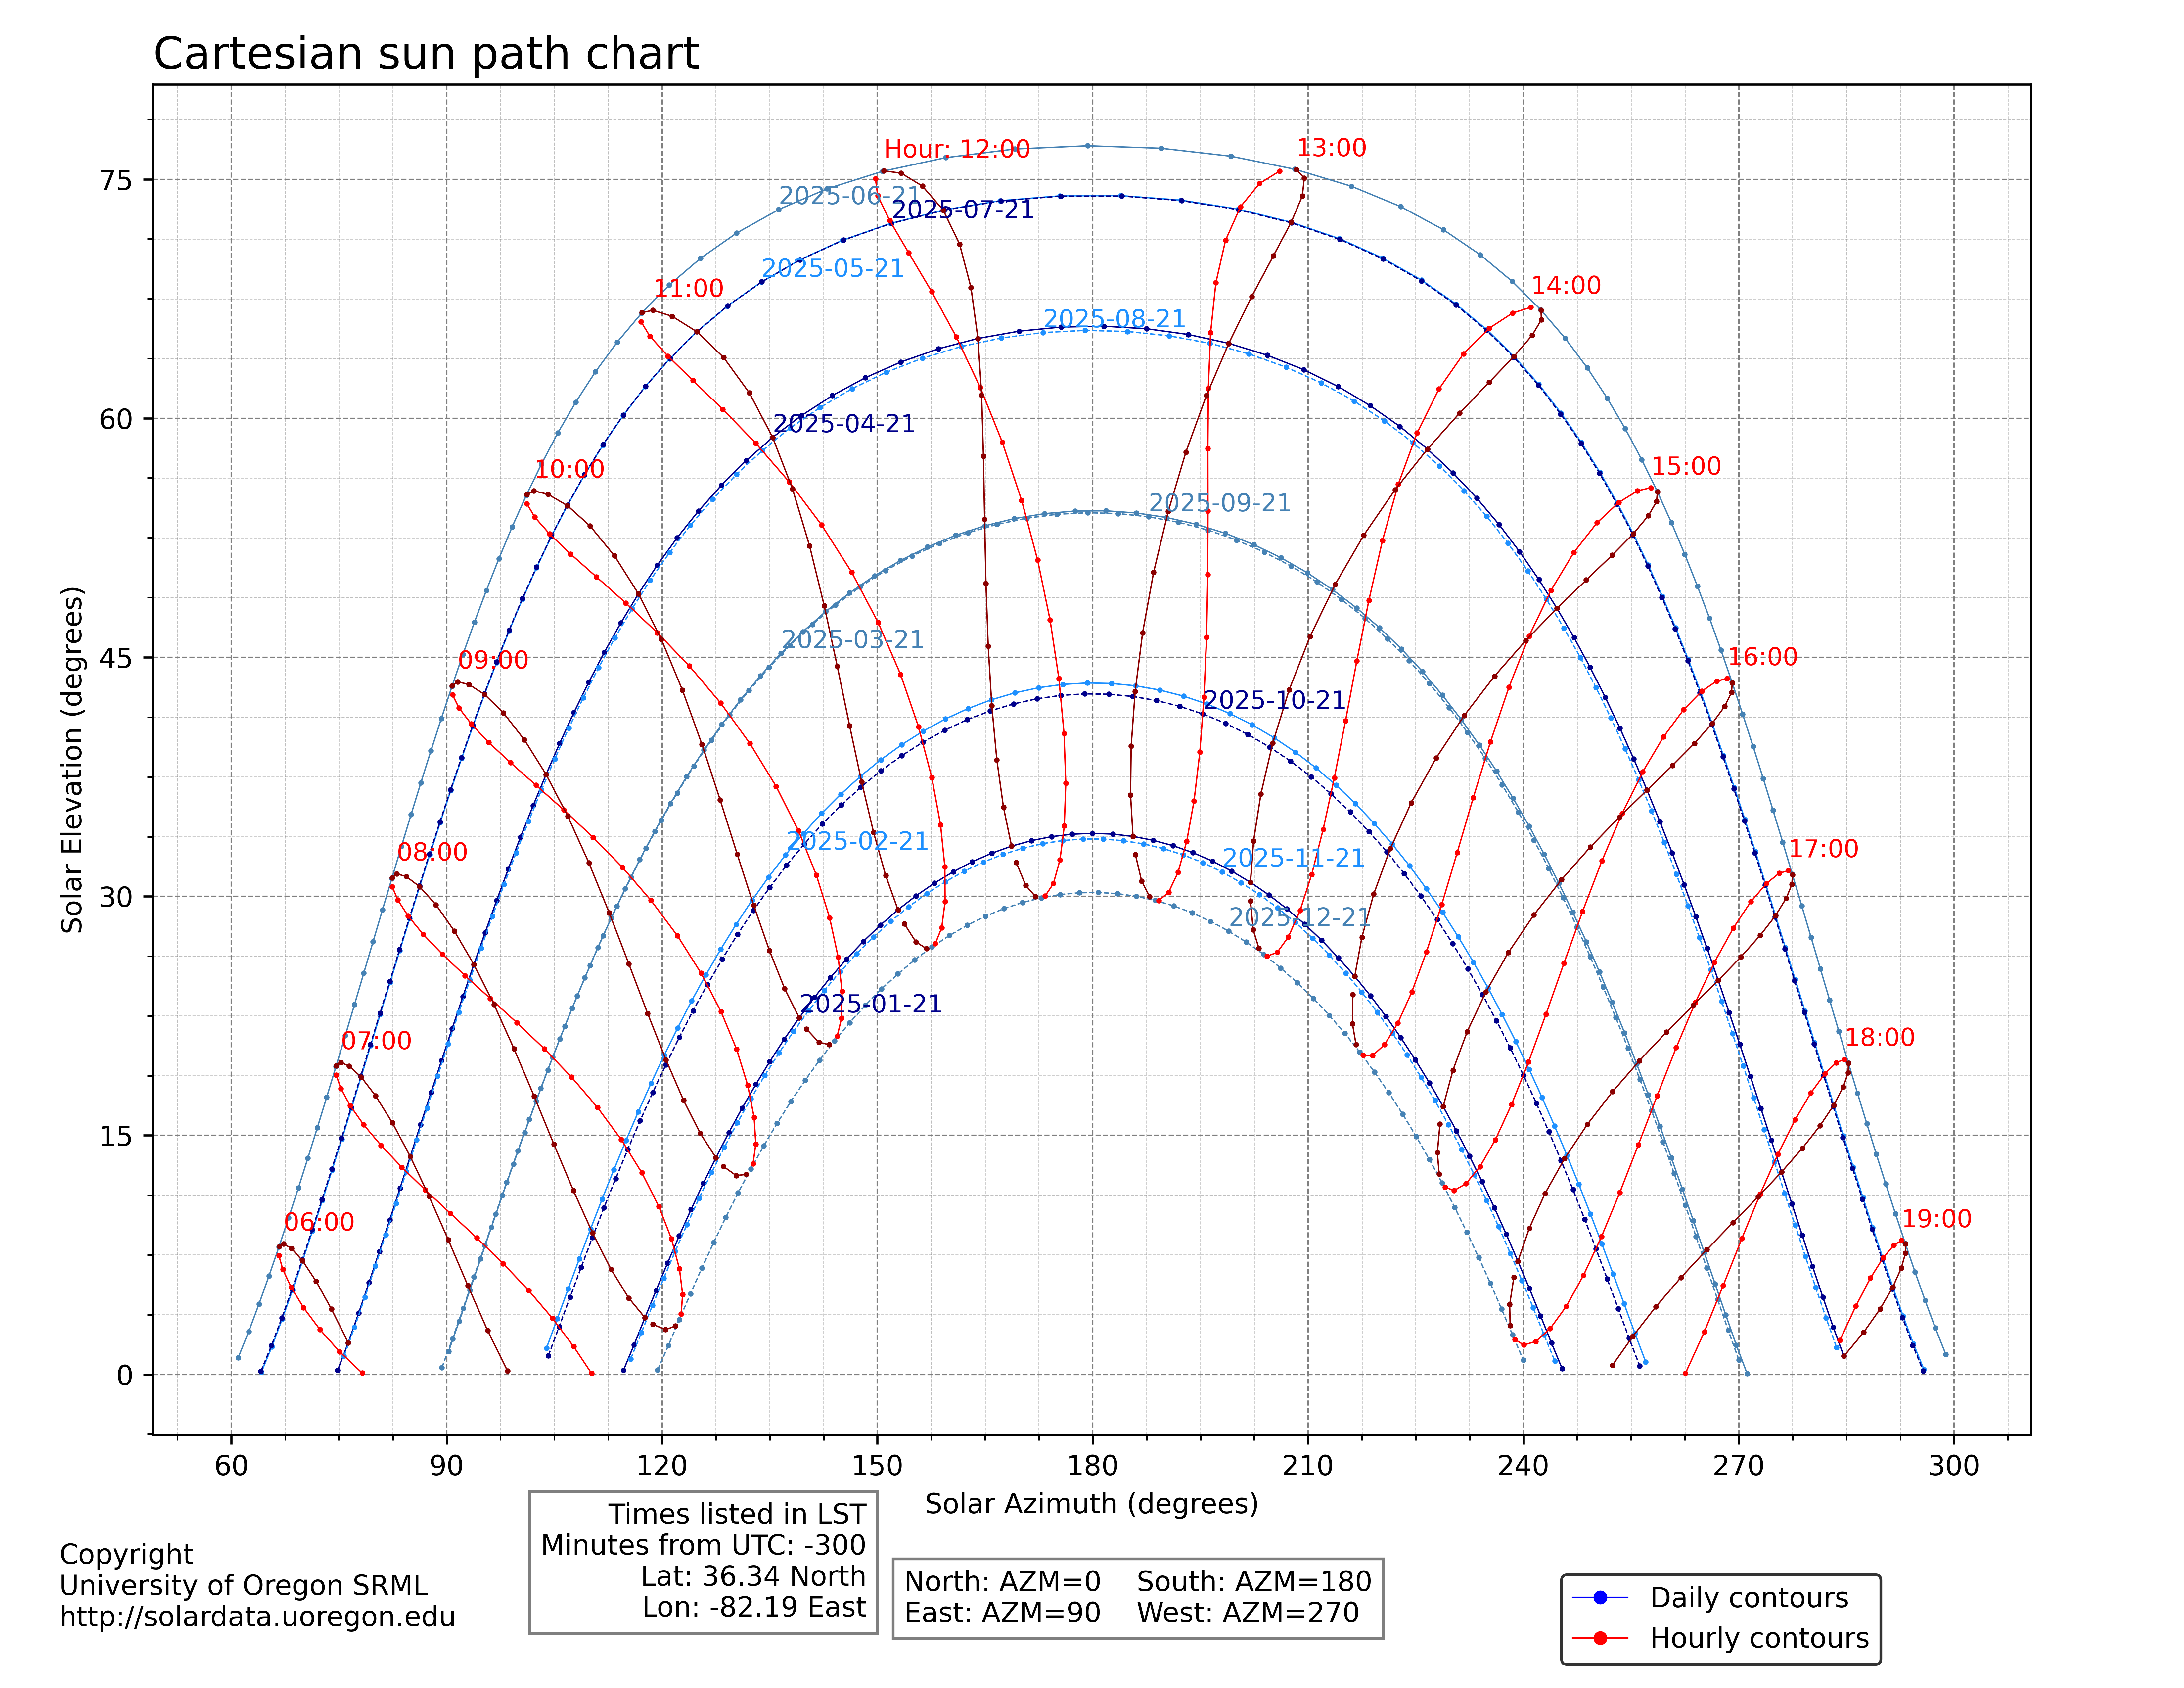
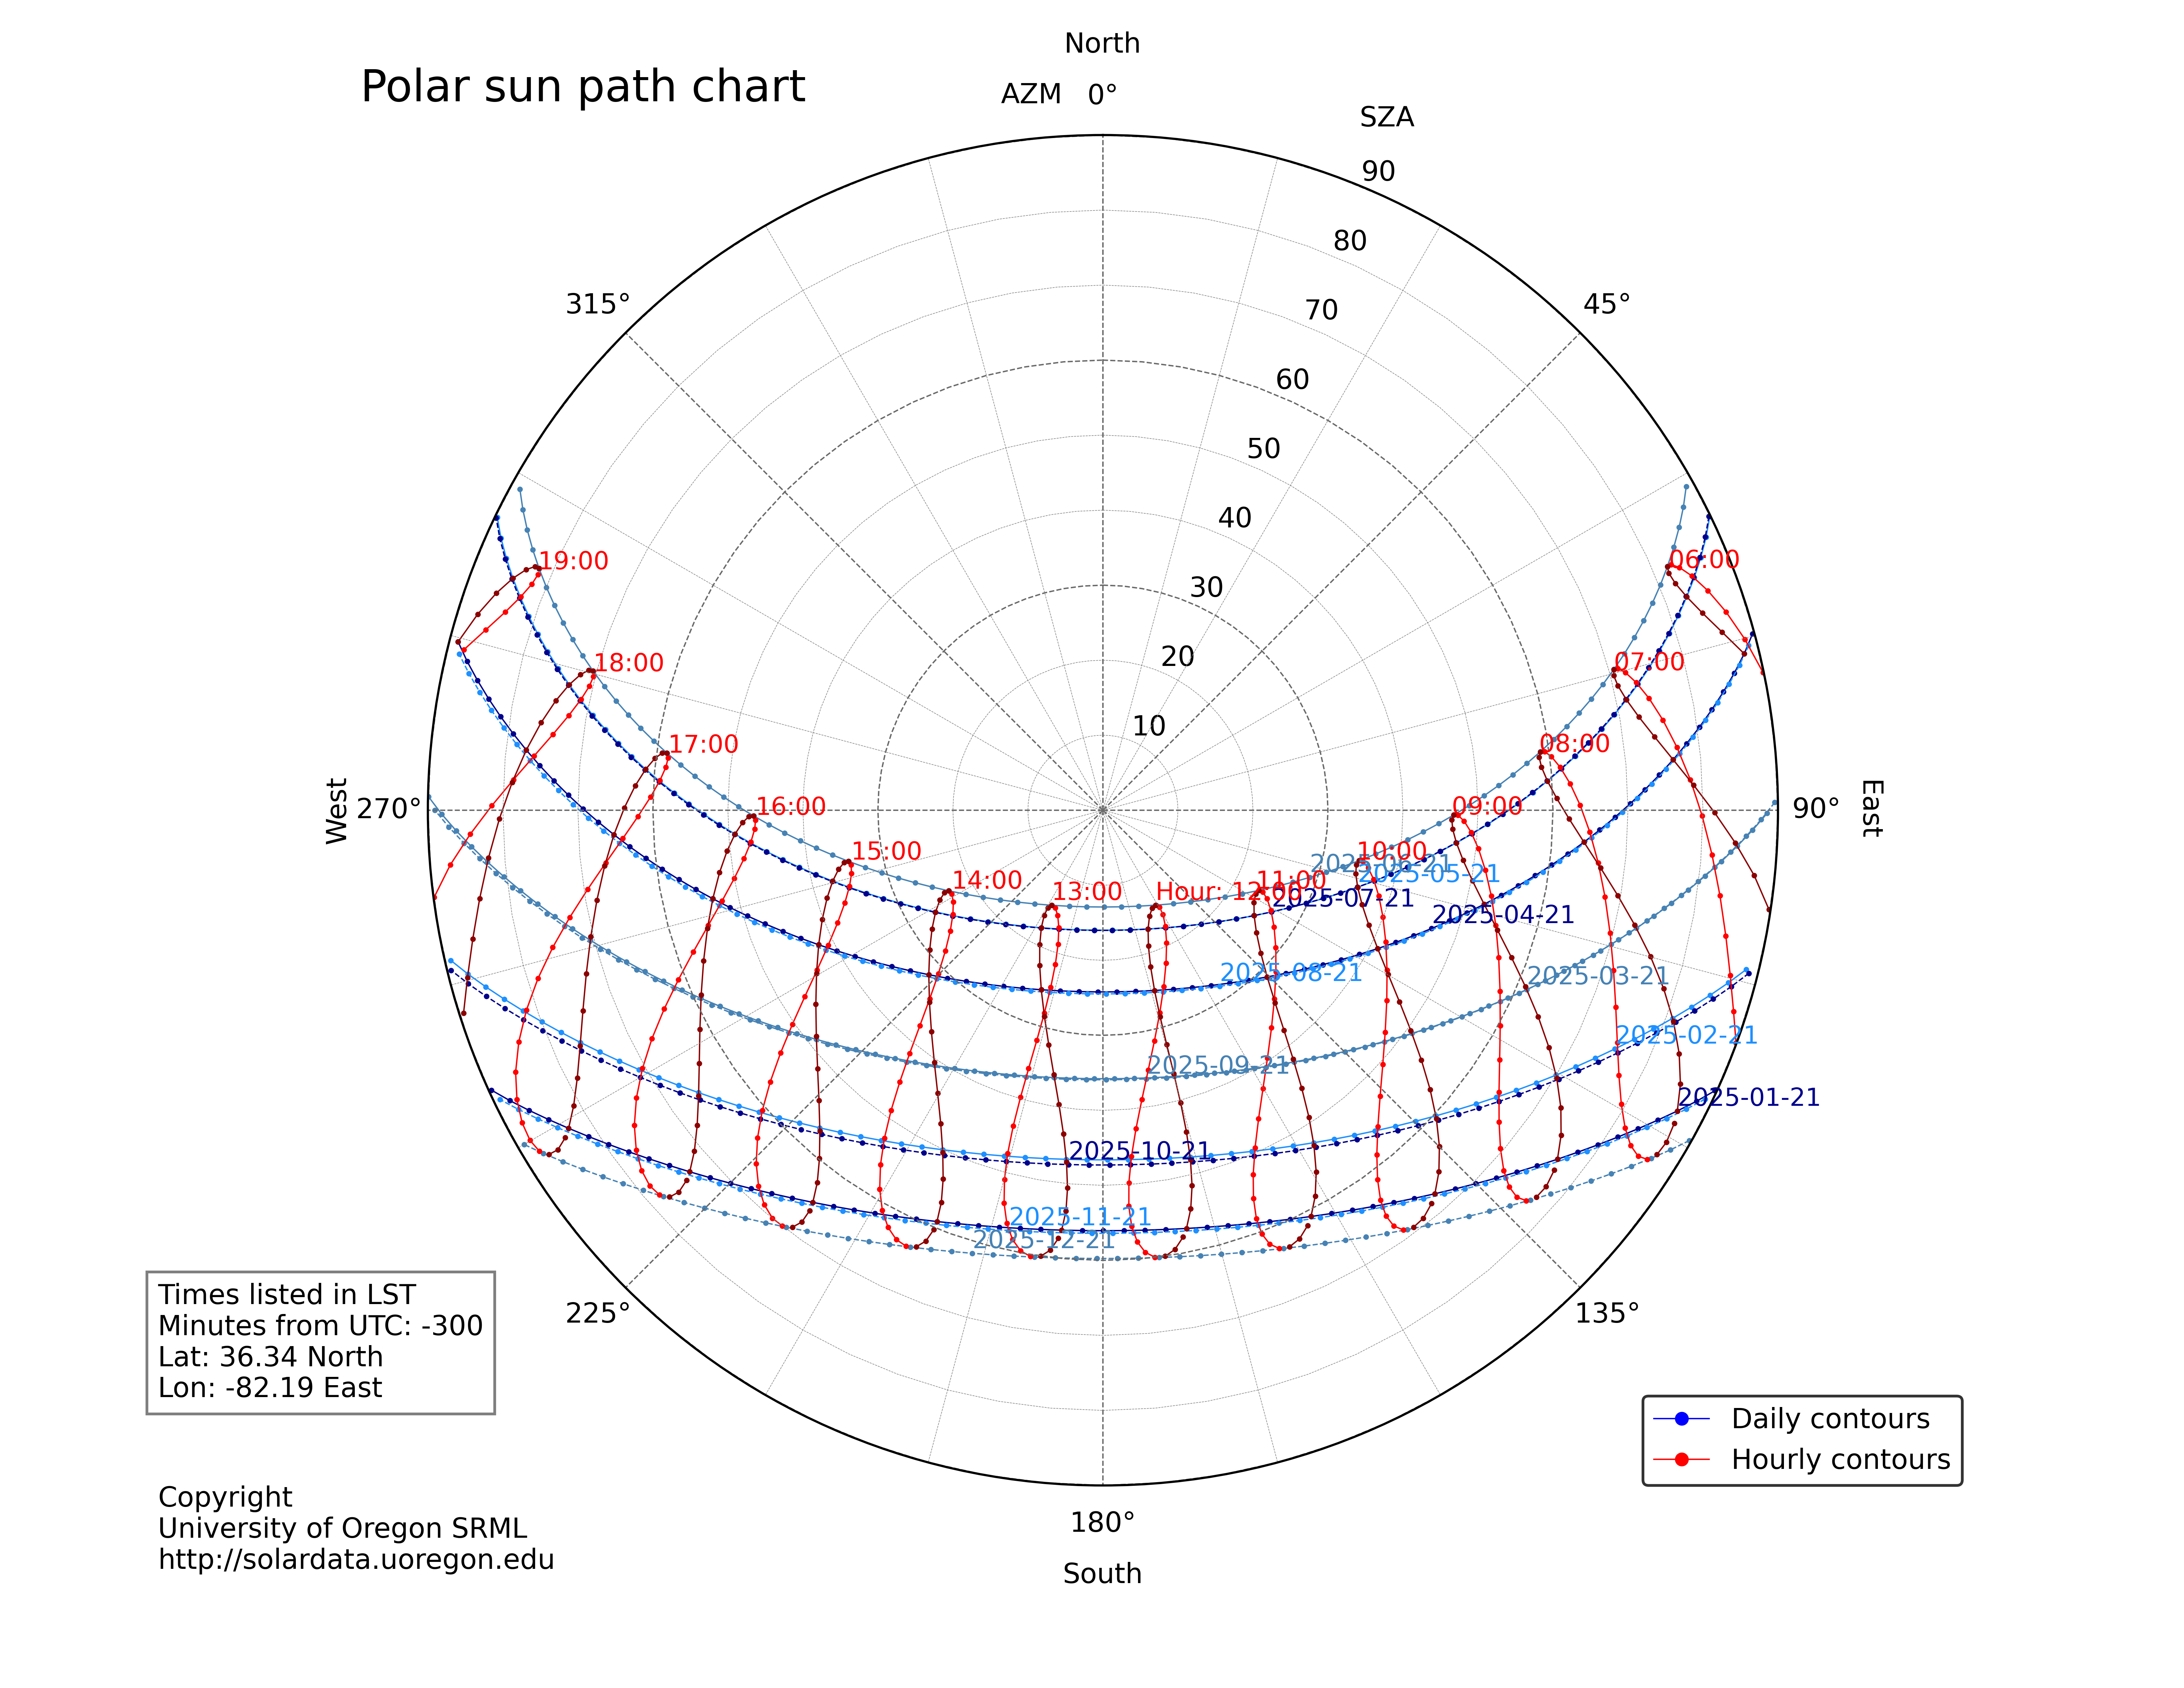
Open the sun path images in another tab for a larger view, or right-click and 'Save as.'
Sun path images are free and made at
University of Oregon's website.
The charts are derived from
Dygraph free chart software.
Data is collected from 6:00AM (dawn) to 7:00PM (sunset). The graphs are displayed until midnight.
From 12:00AM (midnight) until 6:00AM (dawn), the page is blank, except for this text and the links at the bottom.